Site Meter Mapping & KPIs That Measure What Actually Matters
A structured study that defines how your site should measure energy performance: the right KPIs for how you actually operate, mapped to the exact metering needed to generate them, in one visual EnPI map your whole team can use.
- Defines the right Energy Performance Indicators before any meter is specified
- Maps existing metering, finds the gaps, and prioritises what to add
- Built to ISO 50001 best practice from the outset
- A visual EnPI map that stays with the facility as its measurement model
- Part of SHV Energy
- ISO 50001
What This Service Is
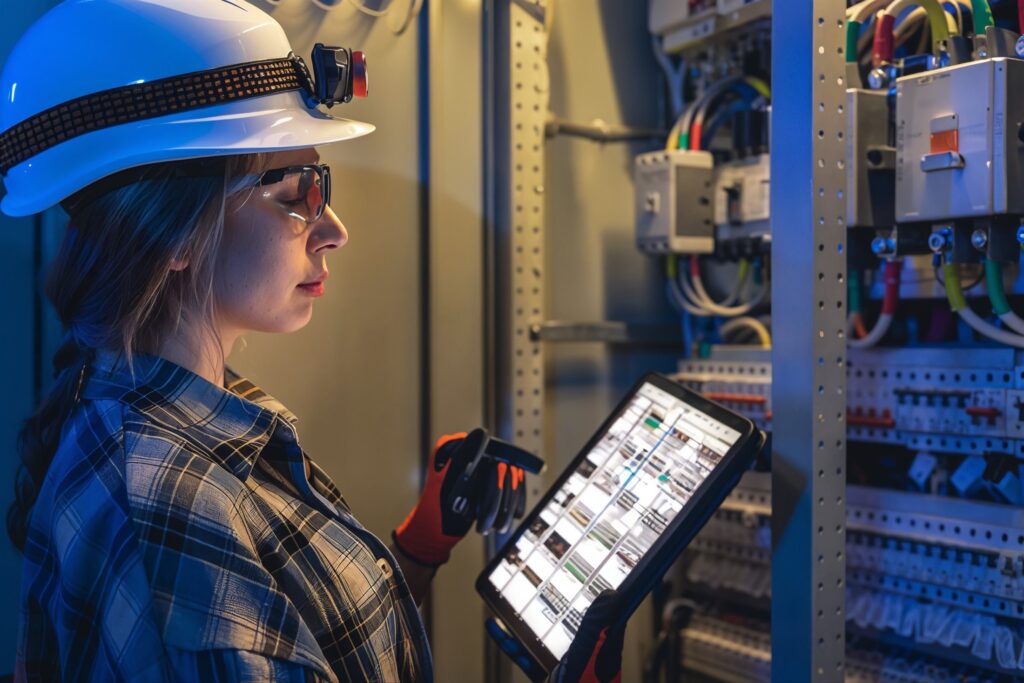
Site Meter Mapping and KPIs Generation is a structured engineering study that defines how a site should measure and track its energy performance, based on its actual systems, operations and data availability. We deliver it through Energy Performance Indicator (EnPI) maps that define what metrics the site needs to monitor, how those metrics are calculated, what meters are required to generate them, and how those measurements relate to the site's significant energy users.
The service always links two parts. The first is defining the correct KPIs, which we call EnPIs: measurable indicators that show how efficiently energy is being used across systems such as boilers, compressed air, refrigeration or production processes. The second is mapping the metering infrastructure required to generate those KPIs: identifying existing meters, validating how data is currently captured, and determining what additional instrumentation is required to measure performance accurately. The output is not theoretical. It is a complete map of how energy performance should be measured, tied directly to the physical systems and instrumentation required to support it.
Governing standardISO 50001 · EnPIs
The Challenge It Solves
Before this service, the client typically does not have a reliable way of measuring energy performance at system level. Energy data may exist at a high level, total electricity or fuel consumption, but there is no structured way to understand how energy is used across different systems, how efficient those systems are, or what is driving changes in performance. The site cannot confidently answer which systems are performing poorly, where energy is being lost, or what to prioritise.
Often the metering setup is incomplete or poorly structured: critical data is missing, not connected, or not aligned with meaningful performance indicators, so even a site with multiple meters cannot turn the data into usable KPIs. That becomes a blocking issue. Without defined KPIs and the metering to support them, the site cannot establish baselines, track improvements, justify investments or meet ISO 50001 in a structured way. The real problem is not we do not have meters. It is that the site does not know what it should be measuring, how to measure it, or whether its current infrastructure can support proper energy performance management.
- Energy data at the meter total, but nothing at system level
- Meters that exist but do not translate into usable KPIs
- No baselines to track improvement or justify investment against
- No structured measurement foundation for ISO 50001
How EM3 Delivers It
Identify the Significant Energy Users
We start by identifying the systems and processes that consume the majority of the energy and therefore drive your cost and performance.
Define the right EnPIs
We establish the correct Energy Performance Indicators for each system, selected on ISO 50001 best practice and designed to measure how efficiently each system is operating, not just how much energy it consumes.
Define the data required
We define what data is needed to generate those indicators, including the energy data, the production data and any operational inputs that influence performance.
Review metering and run a gap analysis
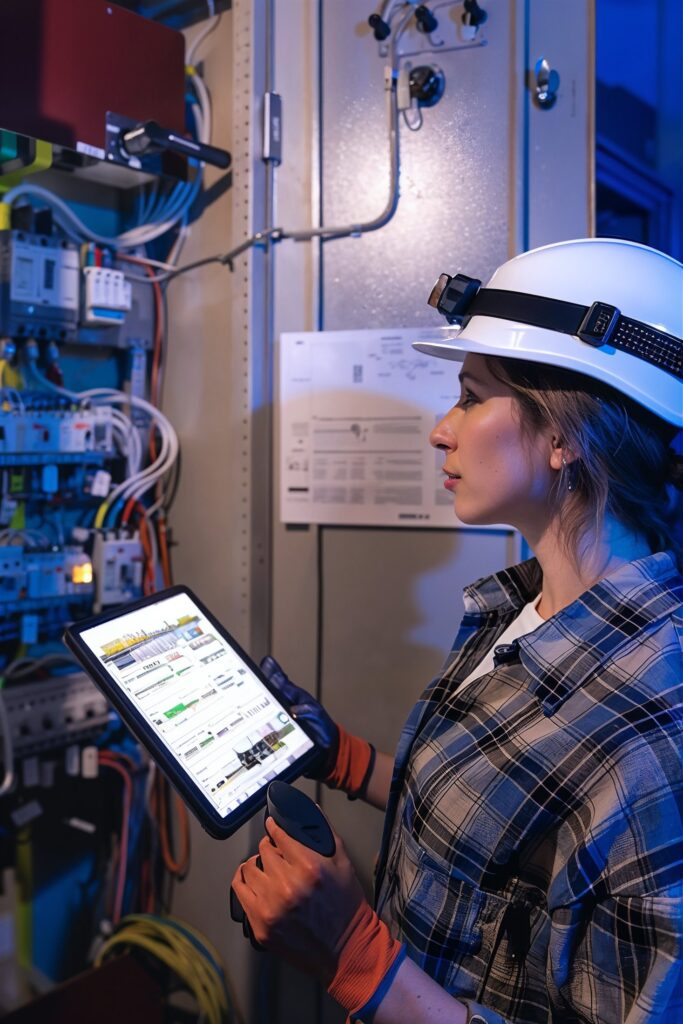
We analyse your P&IDs, system layouts, metering points and data-collection methods to understand what is already in place, then run a full gap analysis to find where data is missing, where meters are not installed, where measurements are inaccurate or where systems are not connected in a way that supports KPI generation.
Generate prioritised actions
We produce a structured set of actions to close the gaps, additional metering, data-collection improvements and system-level changes, prioritised and ranked on cost and impact.
Build the EnPI map and roadmap
We bring it together into a visual EnPI map showing the relationship between the energy systems, the required metrics, the existing meters and the missing instrumentation, and where useful a phased metering roadmap separating immediate priorities from longer-term improvements, with high-level cost estimates.
What You Receive
The EnPI map
The central output: a visual map showing all your energy systems, their associated KPIs, the existing meters and the missing measurement points, designed to stay with the facility as its reference model for energy measurement.
A defined set of EnPIs
Energy Performance Indicators linked directly to each significant energy user, so performance can be measured in a meaningful and consistent way.
A metering gap analysis
A detailed view of what is currently missing in terms of data, instrumentation and measurement capability.
A structured action plan
What needs to be implemented to enable full performance tracking, with prioritised recommendations for meter installation and system improvements.
A phased metering roadmap
Immediate priorities separated from longer-term improvements, with high-level capital estimates, so you can plan the investment in a controlled way.
A foundation for energy management
The groundwork for an energy management system and ISO 50001, with the site prepared to monitor performance and deliver structured savings over time.
Proven Outcome
EnPI mapping is the foundation other things are built on. In our work it is positioned as the first step before deploying an energy management system, getting the site ready for ISO 50001 and capable of delivering structured savings over time.
Once the right indicators are in place and the metering supports them, a site can finally monitor performance at system level, see exactly where the inefficiencies are, and pursue the kind of savings typical of best-in-class systems, in the range of 8 to 20 percent depending on how fully it is implemented. The map itself is designed to stay with the facility as its reference model for energy measurement for years.


Why EM3
KPIs first, meters second
We do not start with the meters and try to use whatever data is available. We start by defining the right performance indicators based on how your site actually operates, then work backwards to design the metering that supports them. That way every meter has a clear purpose tied to a KPI and a decision, rather than generating unused or disconnected data.
ISO 50001-aligned from the outset
All the KPIs, baselines and measurement approaches are consistent with internationally recognised energy management standards from day one, so the work supports certification rather than having to be redone for it.
Visual and usable by everyone
The EnPI maps are designed to be understood by all stakeholders, not just energy specialists, which makes the outputs genuinely usable across engineering, operations and management.
Grounded in real site data
The work is built from your P&IDs, system layouts and actual metering infrastructure, so the recommendations are practical and implementable, not generic.
How We Engage


Frequently Asked Questions
We already have meters, why do we need this?
Having meters is not the same as measuring performance. The real question is whether you know what you should be measuring, whether your meters support those indicators, and whether the data turns into usable KPIs. Often it does not, even with a lot of meters.
What is an EnPI?
An Energy Performance Indicator: a measurable indicator that shows how efficiently energy is being used across a system, a boiler, compressed air, refrigeration or a production process, not just how much it consumes. They are defined on ISO 50001 best practice.
What is the main output?
A visual EnPI map showing every energy system, its KPIs, the existing meters and the missing measurement points, plus a metering gap analysis, a prioritised action plan and a phased metering roadmap with high-level costs.
Do you design KPIs around our meters, or meters around our KPIs?
KPIs first. We define the right indicators based on how your site actually operates, then work backwards to design the metering that supports them, so every meter has a clear purpose tied to a decision.
How much can we save?
The mapping itself defines the measurement foundation. Once the metering and management are in place, sites can reach the savings typical of best-in-class systems, in the range of 8 to 20 percent depending on how fully it is implemented.
How long does it take?
It is a short, defined study, typically a site visit and subsequent analysis, delivered for a fixed fee. The metering installation and platform integration are separate scopes.
Dig Deeper
 Report
Data centre energy reporting: what the EED requires
The recast EU Energy Efficiency Directive has made data centre energy performance a matter of public record. This report explains…
 Upcoming23 Jun 2026
Multi-site ISO 50001: when group certification works, and when it doesn’t
With Graciano Tornero
 Case study
How a European steel processor cut reheat furnace fuel by 14% per tonne rolled
 Article
Ventilation on demand: the quiet win in mining energy
 Framework
The chemical site electrification framework
A six step engineering method for electrifying chemical process heat: map demand by temperature, reduce it, match technologies to temperature…
 Upcoming30 Jun 2026
US heat electrification reality check: carbon, cost & capacity
With James Dooley